Sea level projections and how they have been used
The sea level data used for Watermarks Bristol was based on the information available for the UK at the time. This data in turn was based on the UN Intergovernmental Panel on Climate Change (IPCC) projections. With the support of the Tyndall Centre for Climate Change Research, this information was applied specifically to Bristol. The levels used for Watermarks represented the projected combined effect of sea level rise, an extreme high tide and a storm surge for the year 2107. This combination amounts to a water level of 10.35m (33′ 11″) above the current mean sea level or approx 2m (6′ 6″) higher than the current average high tide. Using LIDAR height data for the city, this level was ‘mapped’ on to the buildings and the position and height of the projected images were set accordingly. Since Watermarks, Bristol, the latest official sea level projections for the UK have been updated and available at the UKCP09 website. The new projections put more emphasis on a range of probabilities, acknowledging a high level of uncertainty. The UKCP09 will be incorporated in to next phase of the project.
This project deals with these predicted scenarios in a particular way – as an art project it plays on this uncertainty. The ‘accuracy’ of the illuminated marks in relation to the scientific data on which they are based and on the actual topography of the city is central to the concept. But the illuminated levels are only as accurate as the data on which they are based – and this data is in a constant state of flux and highly contested. The use of projection as a way of producing these level markers is significant in a number of ways. The prediction of future events based on present trends is spoken of as a projection (e.g. stock market projections) The relationship between projected images and the projected data on which they are based is symbolically significant. The image projections are impermanent, fleeting, made only of light and do not materially affect the surfaces on which they fall. In the same way, projections of future events are provisional – never ‘carved in stone’ whereas actual historical events often quite literally are.
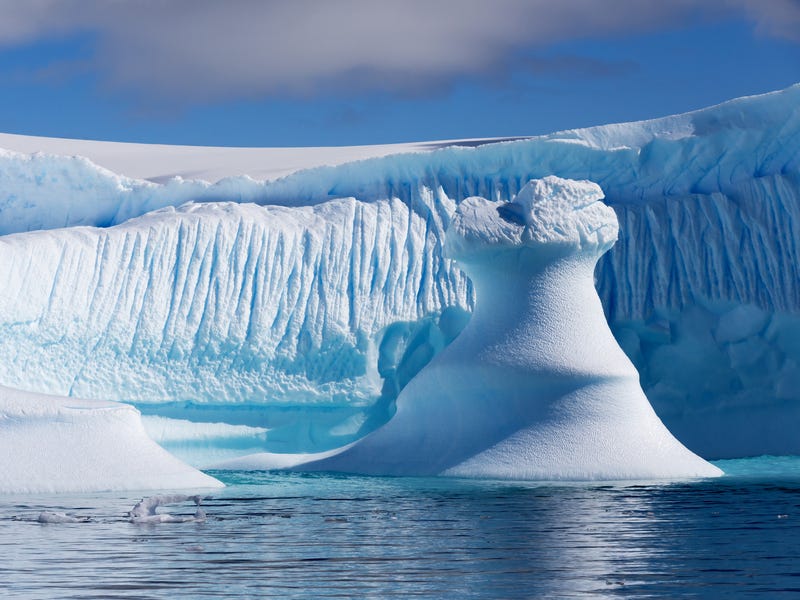
The higher ‘extreme scenarios’ are based on the possible collapse of the Western Antarctic Ice Sheet, which would raise average sea levels by approximately 5 meters (16 feet). This is scientifically plausible, though most scientists consider very unlikely to occur this century. These have been included as a second layer to the project – as philosophical provocations that ask ‘what if?’ and suggest the mythology of flooding.